Background
IC 10 is a nearby dwarf irregular starburst galaxy located approximately 700 kpc away in the constellation Cassiopeia. Despite its small size, it has one of the highest star formation rates per unit mass of any galaxy in the Local Group, making it a rich laboratory for studying stellar populations, high-mass X-ray binaries, and transient phenomena. Its proximity allows individual sources to be resolved and monitored over time, providing an opportunity to catalog variable objects and characterize their behavior across multiple photometric bands.
This project performs a systematic cross-matching and variability study of optical sources in the IC 10 field. The goal is to identify which sources are genuinely variable, classify the nature of their variability, and characterize a set of UV-bright sources located within the galaxy’s HI holes – regions of depleted neutral hydrogen that may trace energetic feedback from young stellar populations or compact objects.
Data
Two complementary datasets are used:
Zwicky Transient Facility (ZTF): A wide-field r-band catalog containing 1,516 unique sources in the IC 10 field, each with multiple-epoch photometry and pre-computed variability classifications.
Las Cumbres Observatory (LCO): Deep multi-band imaging (g’, r’, i’, z_s) from the 2-meter Faulkes Telescope North, processed through the BANZAI pipeline. The r’-band catalog contains 28,211 detected objects, of which 1,976 have sufficient repeat observations for time-domain analysis. Additional V-band imaging was obtained from the LCO 0.4-meter telescope at McDonald Observatory.
Methodology
Catalog Cross-Matching
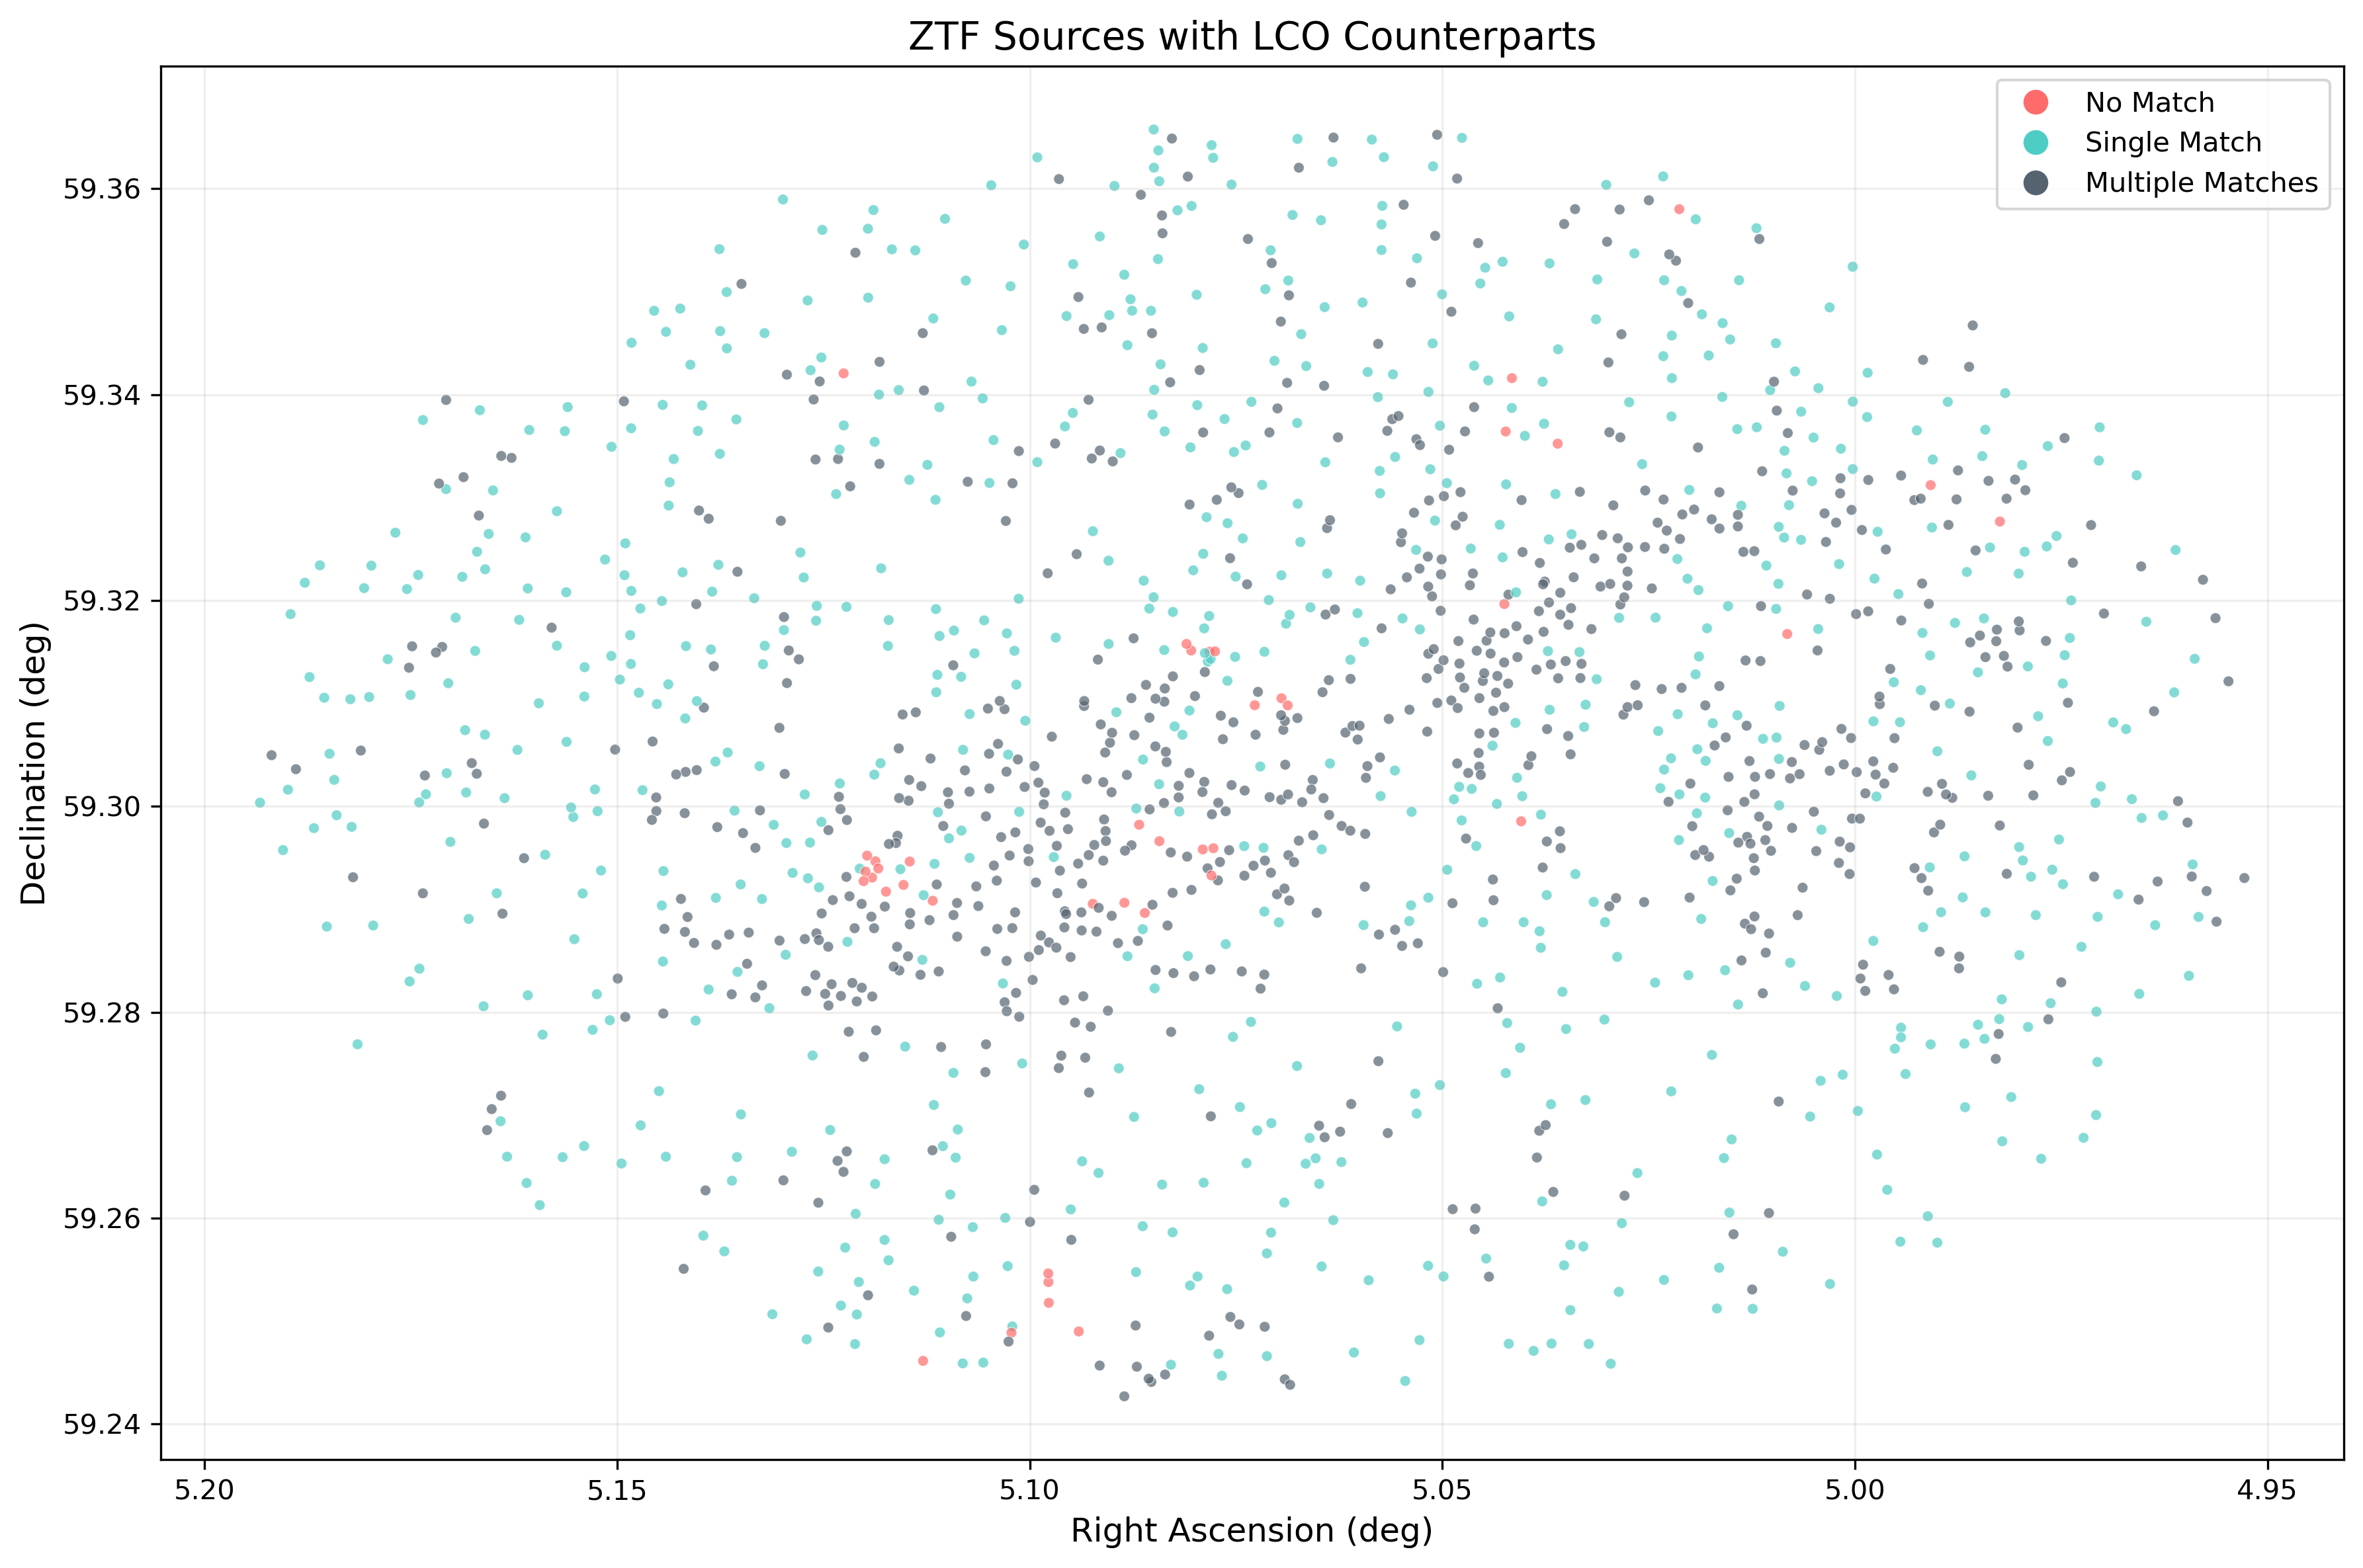
ZTF and LCO source positions are cross-matched within a 2-arcsecond radius using Astropy’s SkyCoord framework. Each ZTF source is categorized as having no match, a single LCO counterpart, or multiple LCO counterparts. Of the 1,516 ZTF sources, 723 have a unique LCO match, 752 have multiple matches (requiring further disambiguation), and 41 have no counterpart in the LCO data.
Reduced Chi-Squared Analysis
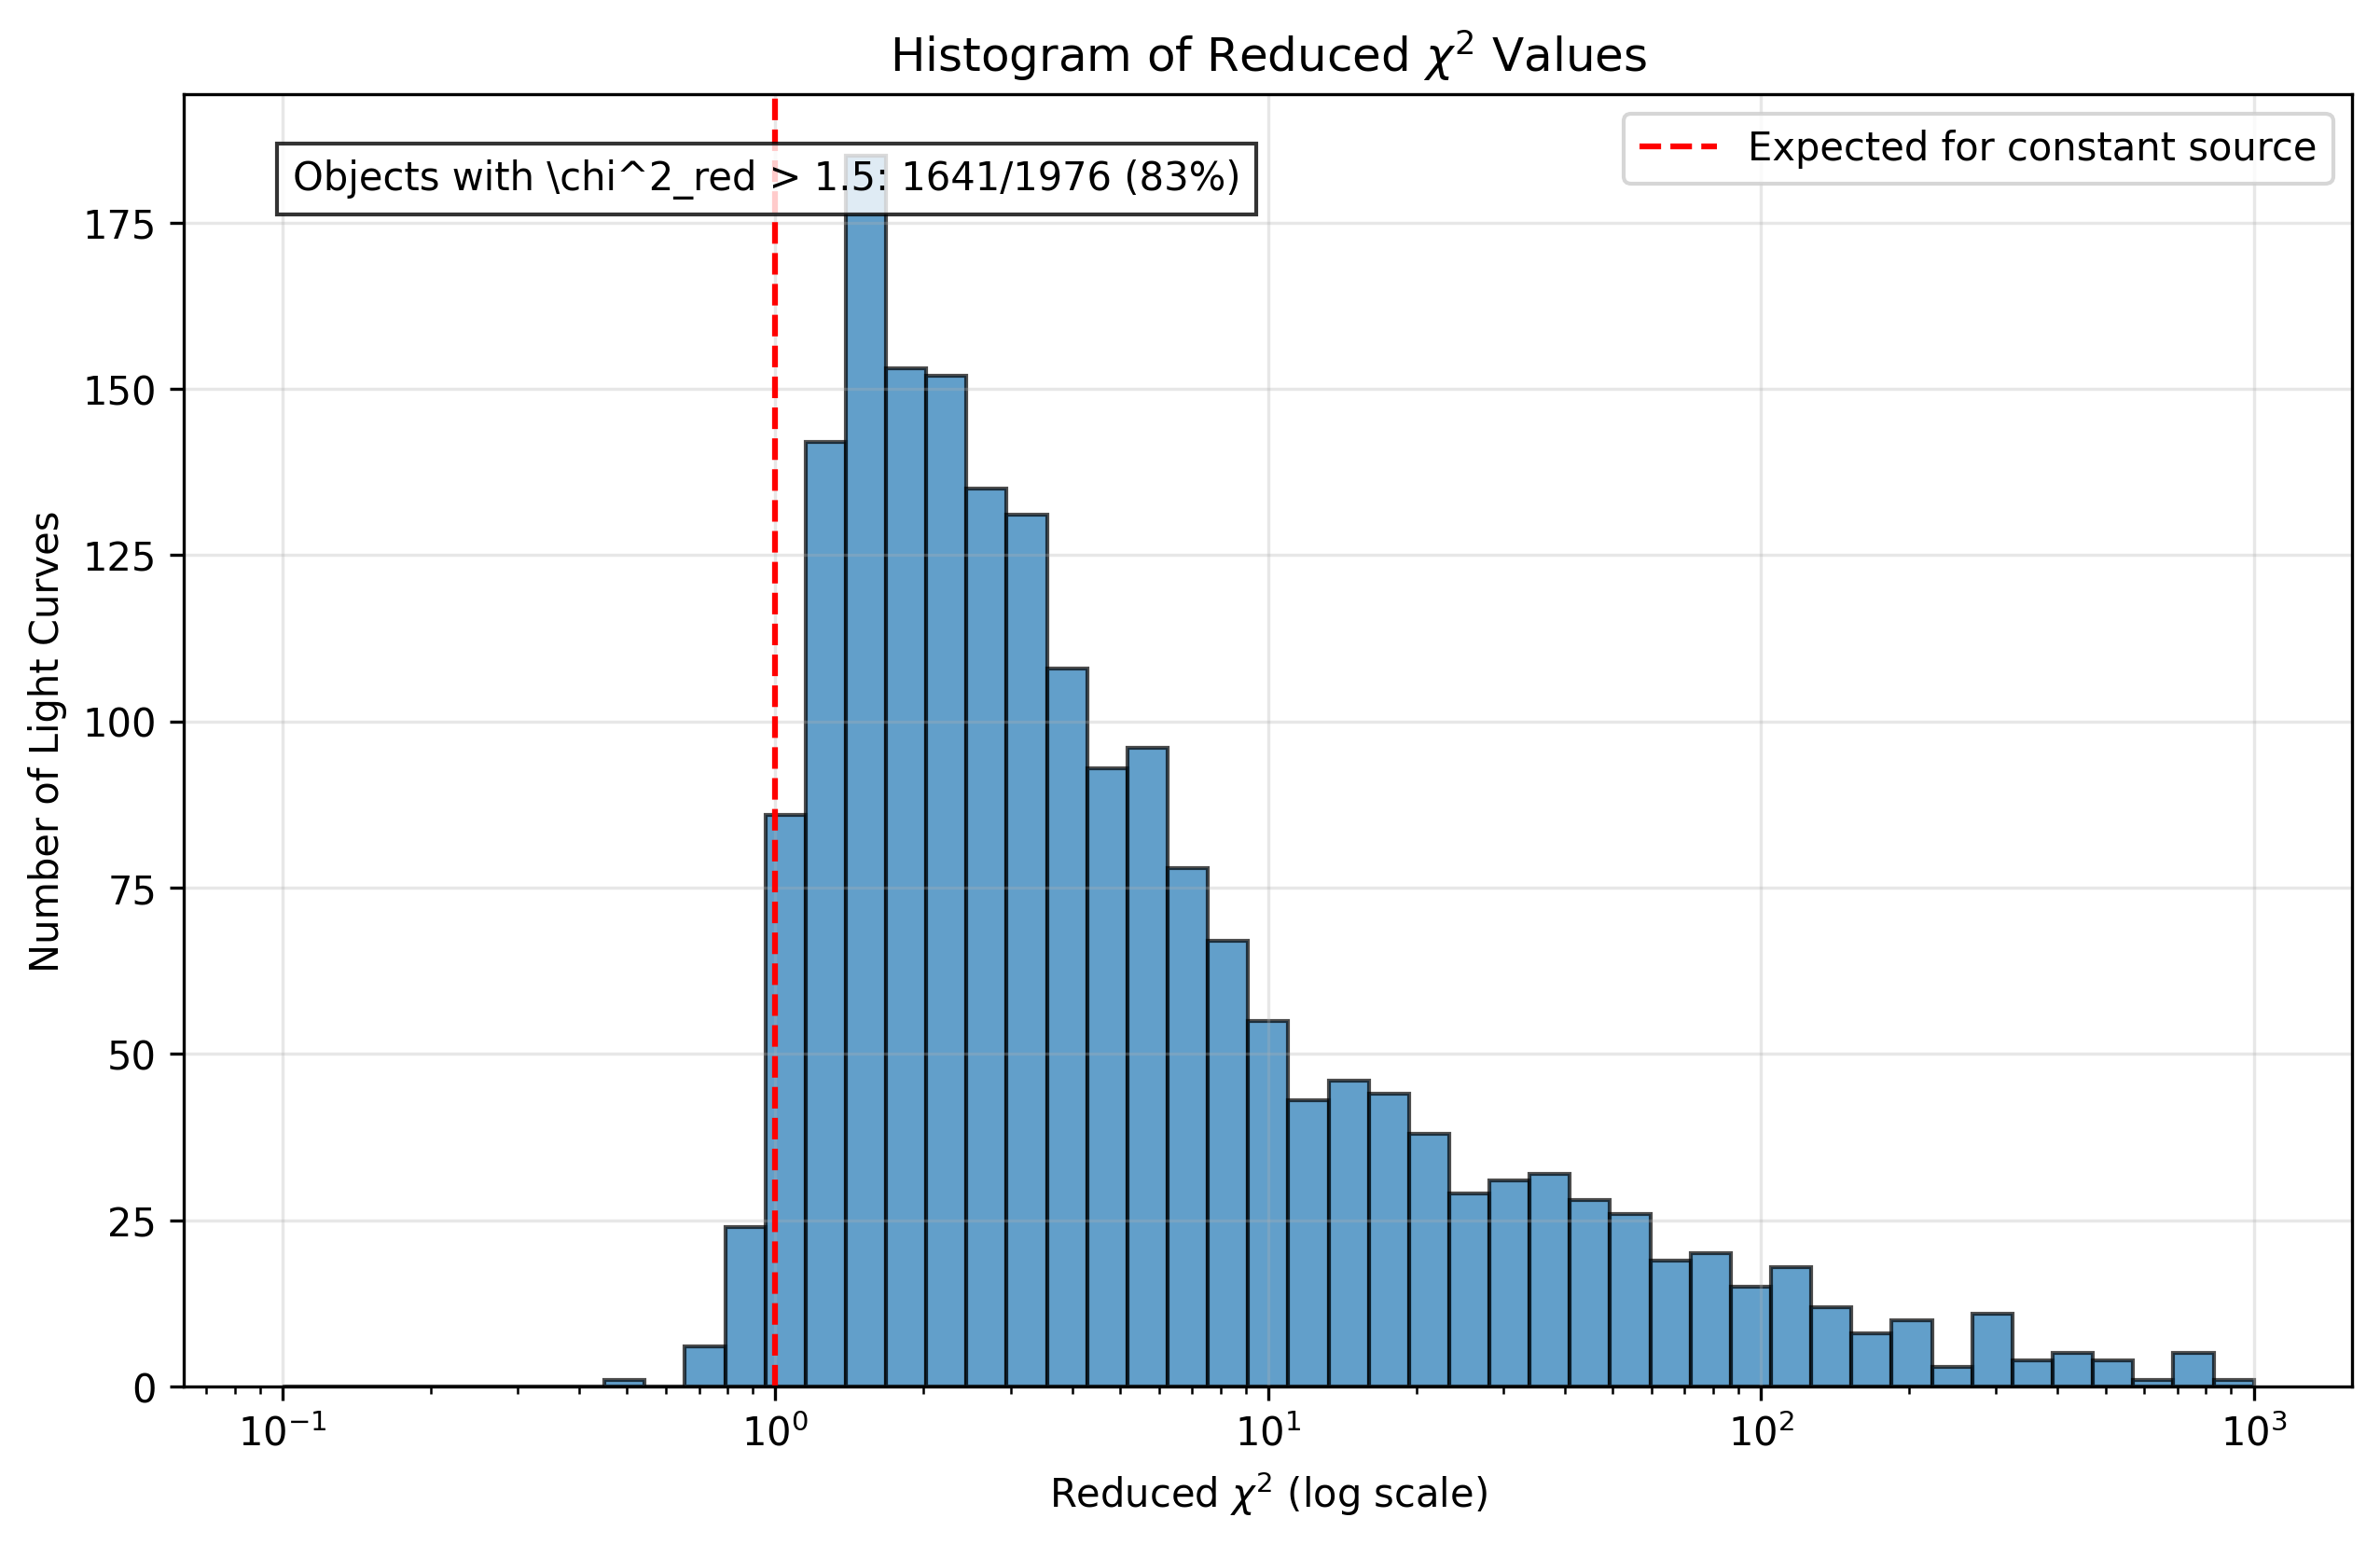
For each LCO source with multiple observations, the reduced chi-squared statistic is computed against the inverse-variance weighted mean magnitude. This tests the null hypothesis that the source is non-variable: a value near 1.0 indicates consistency with photometric noise, while significantly elevated values signal genuine brightness changes. The survival function (the probability of obtaining a chi-squared value at least as large as observed, assuming a constant source) is used to quantify the statistical significance of each detection.
Variability Classification
Sources are classified using a combination of the LCO chi-squared values and ZTF variability tags. Light curve morphology is further characterized through skewness and excess kurtosis of the magnitude distribution. The Lomb-Scargle periodogram is applied to search for periodic signals in the unevenly-sampled light curves, identifying candidate periodic variables among the high-chi-squared sources.
Spectral Energy Distribution (SED) Analysis
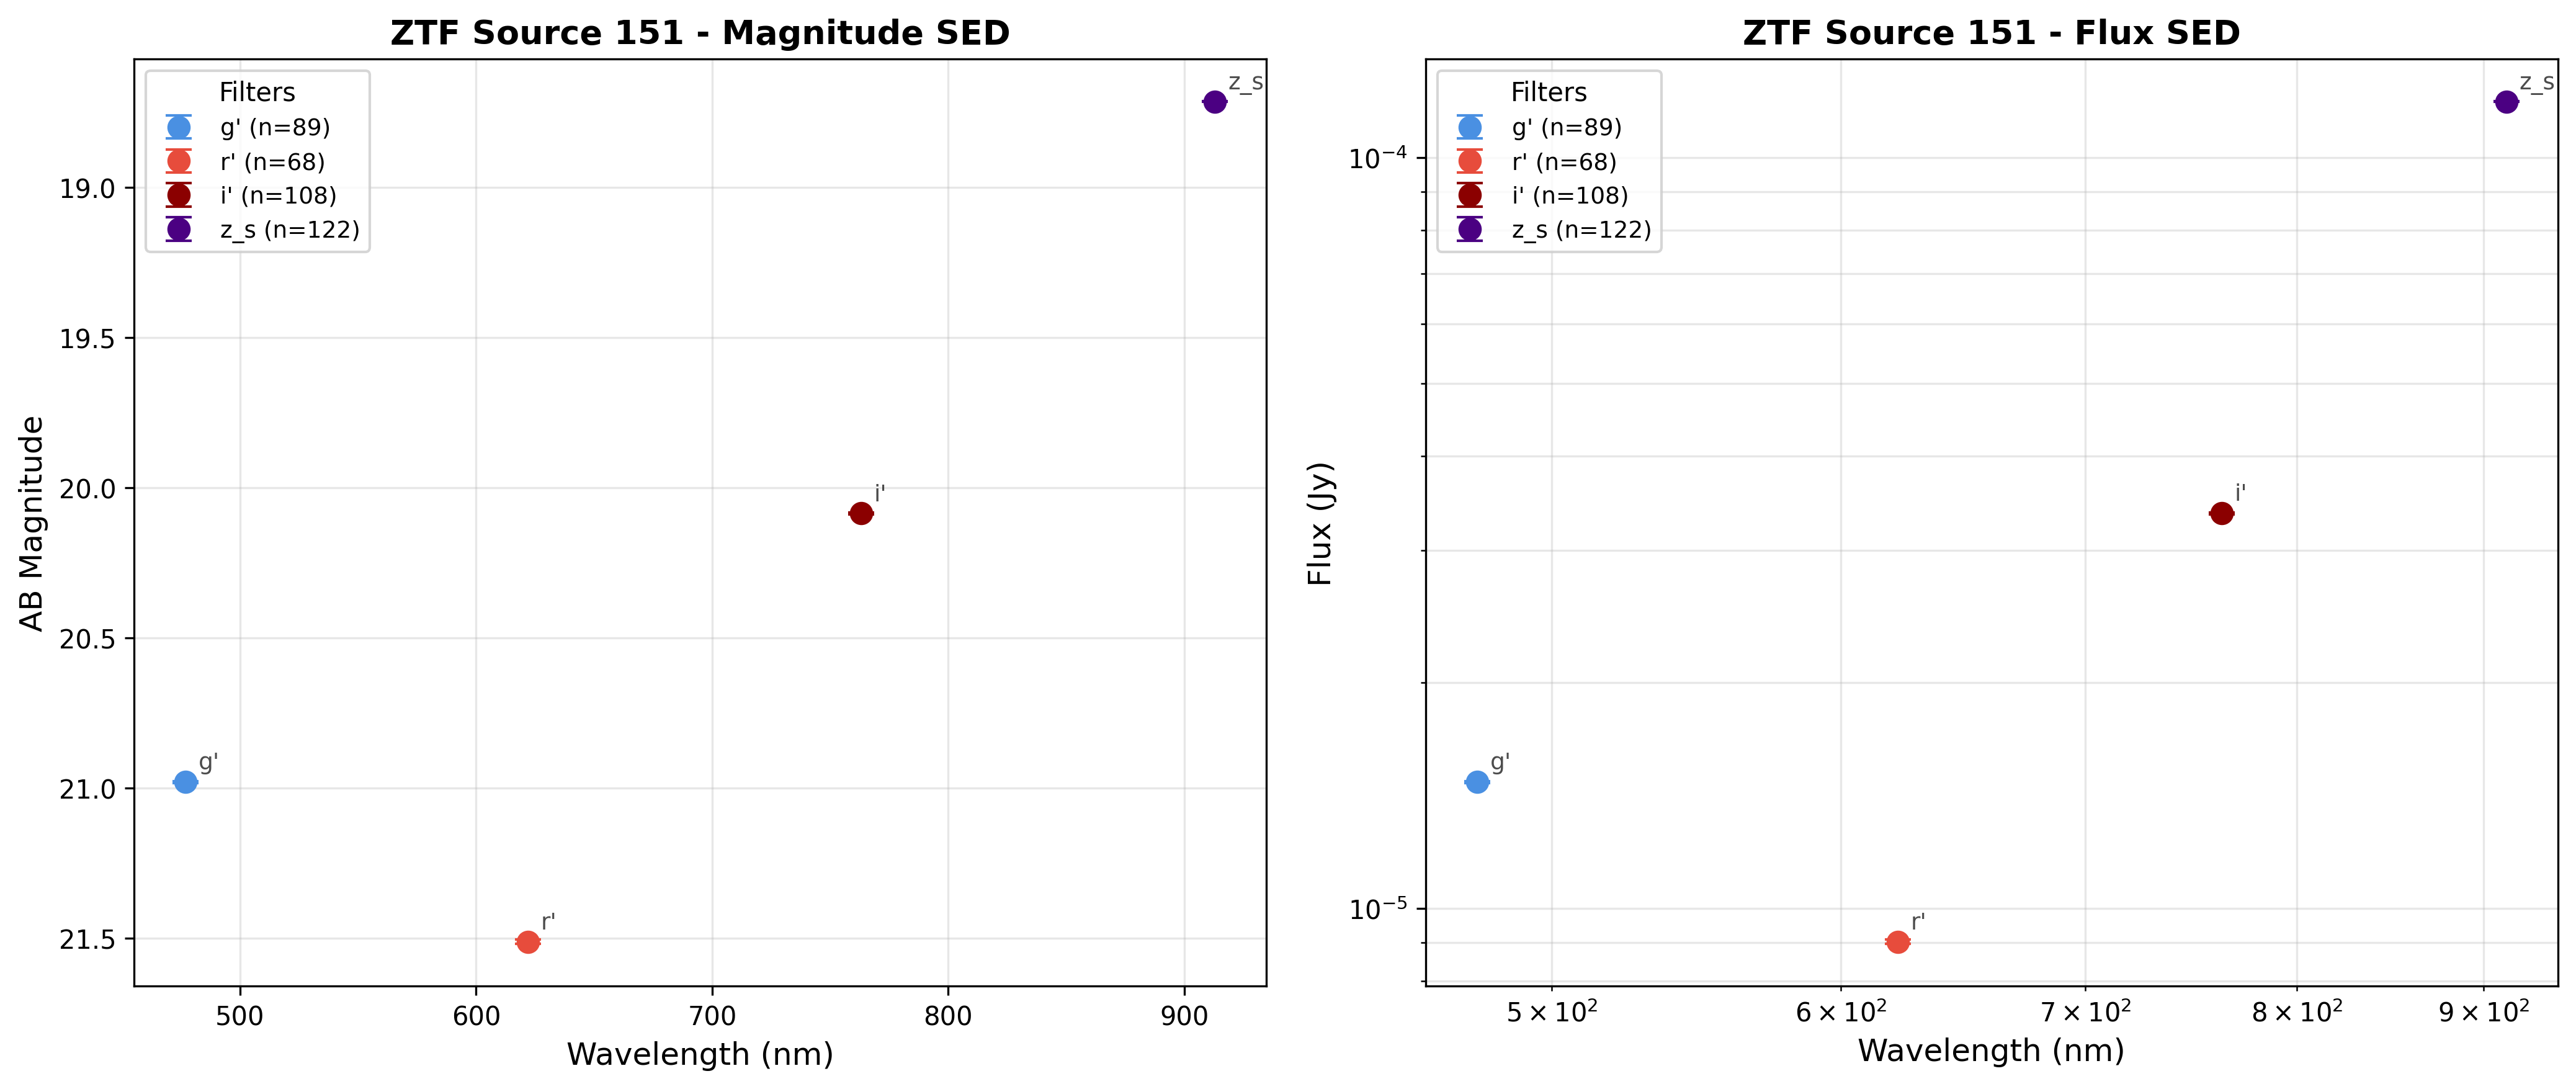
For the target UV sources, multi-band weighted-mean magnitudes are converted to fluxes using the AB magnitude system (3,631 Jy zero-point) and plotted as a function of wavelength from 477 nm (g’) to 913 nm (z_s). Error propagation from the photometric uncertainties provides flux error bars. These SEDs constrain the spectral shape and can distinguish between blue (hot) and red (cool) source populations.
Target Sources
Seven UV-bright sources identified in HI holes of IC 10 receive focused analysis. These sources (ZTF IDs: 777, 2349, 2370, 151, 168, 2205, 2216) are of particular astrophysical interest because UV emission within HI-depleted regions may trace OB associations, Wolf-Rayet stars, or X-ray binary counterparts whose radiative and mechanical feedback carved out the surrounding neutral gas. For each target, the project generates individual light curves, chi-squared statistics, survival probabilities, and multi-band SEDs.
Additionally, IC 10 X-2 – a high-mass X-ray binary known to have undergone an X-ray flare – is monitored separately using LCO r’-band photometry to track its optical counterpart’s behavior during and after the outburst.
Key Results
- The reduced chi-squared distribution reveals a substantial population of variable sources, with a significant fraction exceeding the threshold expected for constant sources.
- Cross-comparison of LCO-derived variability with ZTF classifications identifies potential misclassifications – objects flagged as non-variable by ZTF that show clear variability in the deeper LCO data, and vice versa.
- Among the 7 UV target sources, 5 have sufficient LCO multi-band coverage to construct SEDs, showing a range of spectral slopes from blue to red across the sample.
- Lomb-Scargle analysis identifies a subset of periodic candidates among the variable sources, with periods recovered from the unevenly-sampled LCO cadence.
Figures
Sky Match Plot
Spatial distribution of 1,516 ZTF r-band sources in the IC 10 field, colored by their LCO cross-match status. Red points have no LCO counterpart within 2", teal points have a unique match, and dark blue points have multiple LCO candidates – reflecting source crowding in the galaxy’s dense central region.
Chi-Squared Histogram
Distribution of reduced chi-squared values for 1,976 LCO sources with multi-epoch r’-band photometry. The red dashed line marks chi-squared = 1, the expected value for a non-variable source. The long tail to the right reveals a substantial population of genuinely variable objects whose brightness fluctuations exceed what photometric noise alone can explain.
Spectral Energy Distribution (Source 151)
Multi-band spectral energy distribution for ZTF source 151, one of seven UV-bright objects located in an HI hole of IC 10. Left panel shows AB magnitude vs wavelength; right panel shows flux density in Janskys on a log-log scale. Four LCO bands (g’, r’, i’, z_s) span 477–913 nm, with error bars derived from inverse-variance weighted mean photometry across all available epochs.
Tech: Python, Astropy, pandas, NumPy, SciPy, Matplotlib
Research Group: Gelfand Research Group